
6.6%
Qualified → engaged
The largest modeled funnel bottleneck, pointing to engagement quality rather than more top-of-funnel volume.
Case study / Revenue analytics
From disconnected activity to one validated, decision-ready reporting layer.
I built an end-to-end portfolio system that consolidates lead, CRM, email, SMS and calls, LinkedIn, Loom, website, bookings, sales, verification, and paid ads activity from twelve source files.
A from-scratch rebuild of the reporting architecture I designed at KP Media Group — reconstructed here with placeholder data to protect client confidentiality. The architecture, logic, and modeling are unchanged.
Problem / Approach
Activity lived at different grains and used different identifiers. The build preserves source detail, aligns shared business entities, and exposes curated views so leaders can evaluate funnel, channel, campaign, and paid performance without manually reconciling exports.
Architecture / Data flow
Lead, CRM, engagement, website, bookings, sales, verification, and paid ads
Raw source tables preserved for validation and controlled transformation
Five shared dimensions and eleven activity-focused fact tables
Executive funnel, channel performance, and campaign performance views
Semantic model, measures, campaign/date filters, and five dashboard pages
Modeled insights / Not client outcomes
6.6%
The largest modeled funnel bottleneck, pointing to engagement quality rather than more top-of-funnel volume.
151
Email supplied the strongest scalable booking-intent volume in the modeled channel view.
8,885 / 23
Paid traffic reached the site, but post-click conversion warrants closer attention in this modeled dataset.
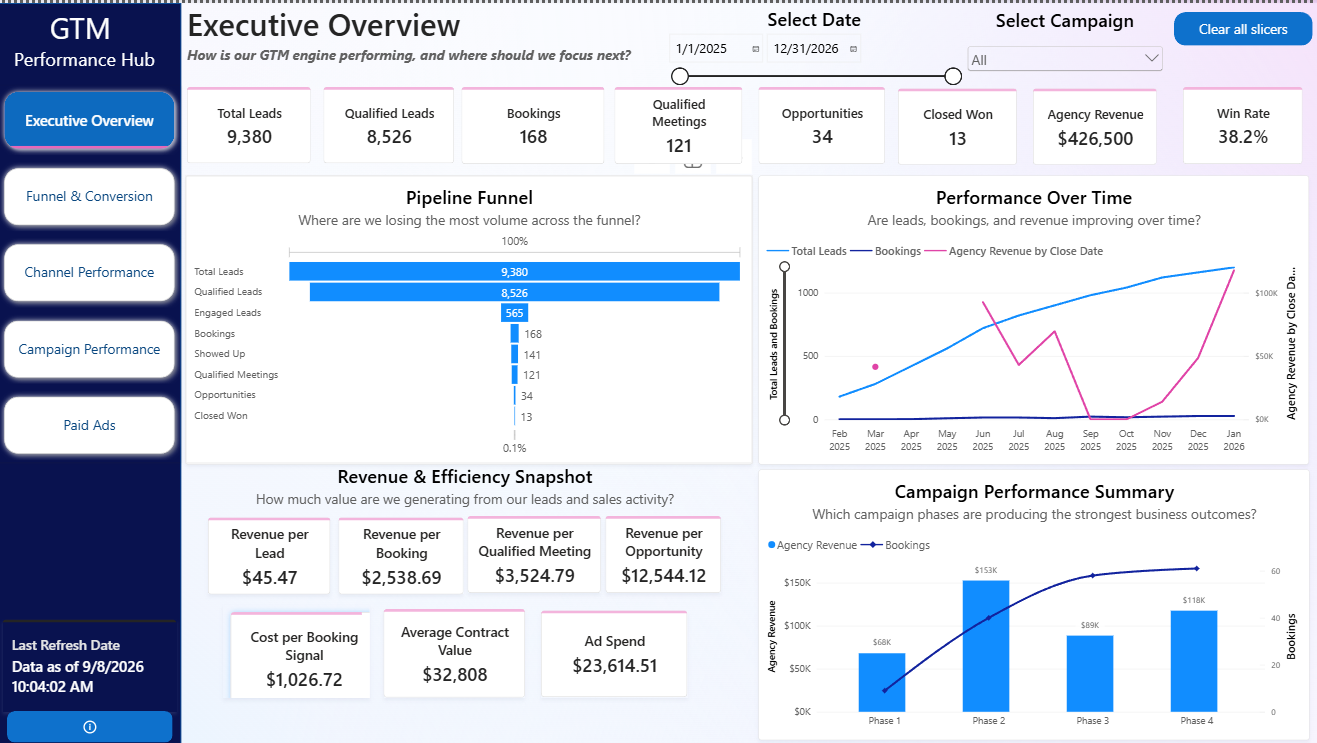
The static pages below show the final Power BI reporting experience. Use the controls to review each view.
Dashboard / 01
How is the modeled GTM engine performing, and where should attention go next?
Build the operating layer